X Cashtag Market Data: New Analysis Format for iOS Users
HyppeSocial April 17th, 2026 X (Twitter)
The Evolution of Financial Tracking on Social Media
X Cashtag market data has become a fundamental tool for investors and traders looking for real-time sentiment and price movements. Originally introduced over a decade ago, the Cashtag—a clickable ticker symbol preceded by a dollar sign—has evolved from a simple search filter into a sophisticated financial dashboard. The latest update specifically targets iOS users in the United States and Canada, introducing a format designed to provide deeper market analysis without requiring users to leave the application.
This shift represents a strategic move to integrate financial literacy and professional-grade data into the daily social media experience. By improving how users interact with financial symbols like $TSLA, $BTC, or $AAPL, the platform is positioning itself as a primary source for immediate market reaction and technical oversight. Industry studies indicate that a significant portion of retail investors now look to social media platforms for breaking news before traditional financial news outlets even publish their reports.
Key Features of the New X Cashtag Market Data Format
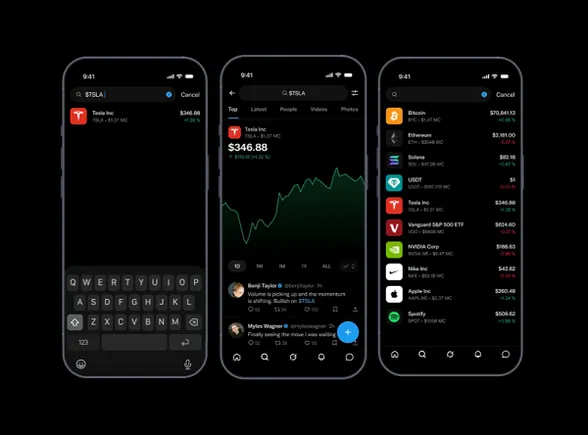
The updated interface on iOS offers several functional improvements over the previous iteration. Instead of a basic redirect to a search results page, users now see a comprehensive visual representation of the asset's performance. The focus is on clarity and actionable intelligence, which is critical during high-volatility trading sessions.
- Interactive Pricing Charts: Users can now view price fluctuations over different timeframes, including daily, weekly, and monthly intervals.
- Real-Time Market Valuation: The data includes updated market caps and current trading prices sourced from industry-standard financial providers.
- Direct Market Context: Below the charts, the platform surfaces the most relevant and high-engagement conversations regarding that specific ticker, allowing for a quick assessment of market sentiment.
- Simplified Navigation: The UI has been streamlined to ensure that the transition between reading a post and analyzing a chart is seamless.
How to Use X Cashtag Market Data for Better Insights
To maximize the utility of the new format, users should understand how to trigger and navigate these features effectively. While the feature is currently rolling out to a specific geographic demographic, its impact on the way information is consumed is universal. For instance, a trader monitoring a sudden surge in a specific stock can click the Cashtag to immediately see if the price movement matches the social hype.
Experts suggest using these tools as a starting point for deeper research. By observing the volume of posts associated with a Cashtag alongside the new visual data, users can identify whether a price movement is driven by fundamental news or speculative social trends. This level of integration helps in reducing the time spent switching between multiple apps, which is often a barrier to efficient decision-making for mobile-first users.
Impact on the Financial Social Media Landscape
The introduction of enhanced financial tools on a social platform changes the dynamic between retail investors and institutional data. In the past, professional-grade charts and market analysis were gated behind expensive terminals or specialized software. By democratizing access to this information through a mobile interface, the platform encourages a more informed discussion among its user base.
Industry research highlights that when users have access to visual data, the quality of discourse tends to improve. Instead of sharing unfounded rumors, users are more likely to reference specific price points or historical trends visible within the app. This creates a healthier ecosystem for financial creators and analysts who use the platform to build their reputation and provide value to their followers.
Practical Use Cases for Financial Professionals
For professionals in the financial sector, the new Cashtag format serves as a quick-reference tool. While it may not replace a dedicated Bloomberg terminal for execution, it serves as an excellent "pulse check" for the market. Here are a few ways professionals are integrating this into their workflow:
- Sentiment Analysis: Comparing the current price chart against the tone of the top-performing posts to gauge public reaction to corporate earnings.
- Trend Identification: Spotting which tickers are gaining traction before they reach mainstream financial news cycles.
- Quick Verification: Fact-checking claims made in viral posts against the actual real-time data provided by the integrated charts.
Regional Limitations and Future Expansion
Currently, the enhanced X Cashtag market data format is restricted to iOS users located in the US and Canada. This phased rollout is a common practice for social media platforms to test server stability and user engagement before a global release. It is expected that Android support and wider geographic availability will follow as the platform refines the data integration based on user feedback from these initial markets.
The focus on iOS suggests a push to capture the high-value demographic of mobile users who frequently engage with fintech applications. As the platform continues to transition into an "everything app," the depth of these financial tools is likely to increase, potentially including direct trading integrations or more advanced technical indicators like moving averages or RSI directly on the Cashtag interface.
Optimizing Your Social Media Presence for Financial News
If you are a content creator or a brand operating in the finance space, these updates require a shift in how you format your posts. Using Cashtags is no longer just about visibility; it is about providing a gateway to data. To take advantage of this, ensure your posts are timed with market hours and provide context that complements the visual charts users will see when they click your tags.
Avoid overusing symbols, as this can be flagged as spam. Instead, focus on the primary ticker relevant to your analysis. This ensures that the user experience remains focused and that the data presented in the new format is directly applicable to the conversation. As we look toward 2026, the integration of real-time data into social feeds will likely become the standard, making these early updates vital for anyone looking to maintain a competitive edge in social media marketing.